This is a fun and quick Christmas project and a reflection on whether I overthink too much.
Compound interest is the eighth wonder of the world. He who understands it, earns it … he who doesn’t … pays it. - Einstein
Regardless whether Einstein actually said that, it is no doubt that even small incremental improvement makes a large difference in the long term. Here I decide to apply the model to personal growth. Here I simulated compound growth rate and see if divided incremental improvement over a smaller period of time is better than sum incremental improvement over a larger period of time.
The conclusion is that assuming the growth rate is constant, there is no tangible benefits of smaller incremental improvement over larger ones. Considering the cost of context switching for reflection (2nd part), there may actually be a disadvantage.
However, the caveat is that we can’t assume growth rate is independent of personal growth. In other words, frequent reflection may help us to maintain a high growth rate and avoid negative growth rate (e.g. procrastination or going in the totally wrong direction). Thus, for future work, this simulation will be repeated with a stochastic error rate that can only be corrected with reflection. For now though, it satisfied my whimsical curiosity.
assume one grow 0.001 per hour
- the first model assumes daily growth of 0.024 after 365 days
- the second model assumes hourly growth of 0.01 after 365*24 hours
a <- tibble(x = 1:(365*10)) %>%
  mutate(daily = 1.01^x, hourly = (1+0.01/100)^(x*100)) %>%
  pivot_longer(cols = c(daily, hourly), names_to = "frequency", values_to = "growth")

ggplot(a) +
  aes(y = growth, x = x, colour = frequency) +
  geom_line() +
  scale_color_manual(values = c("blue", "red"))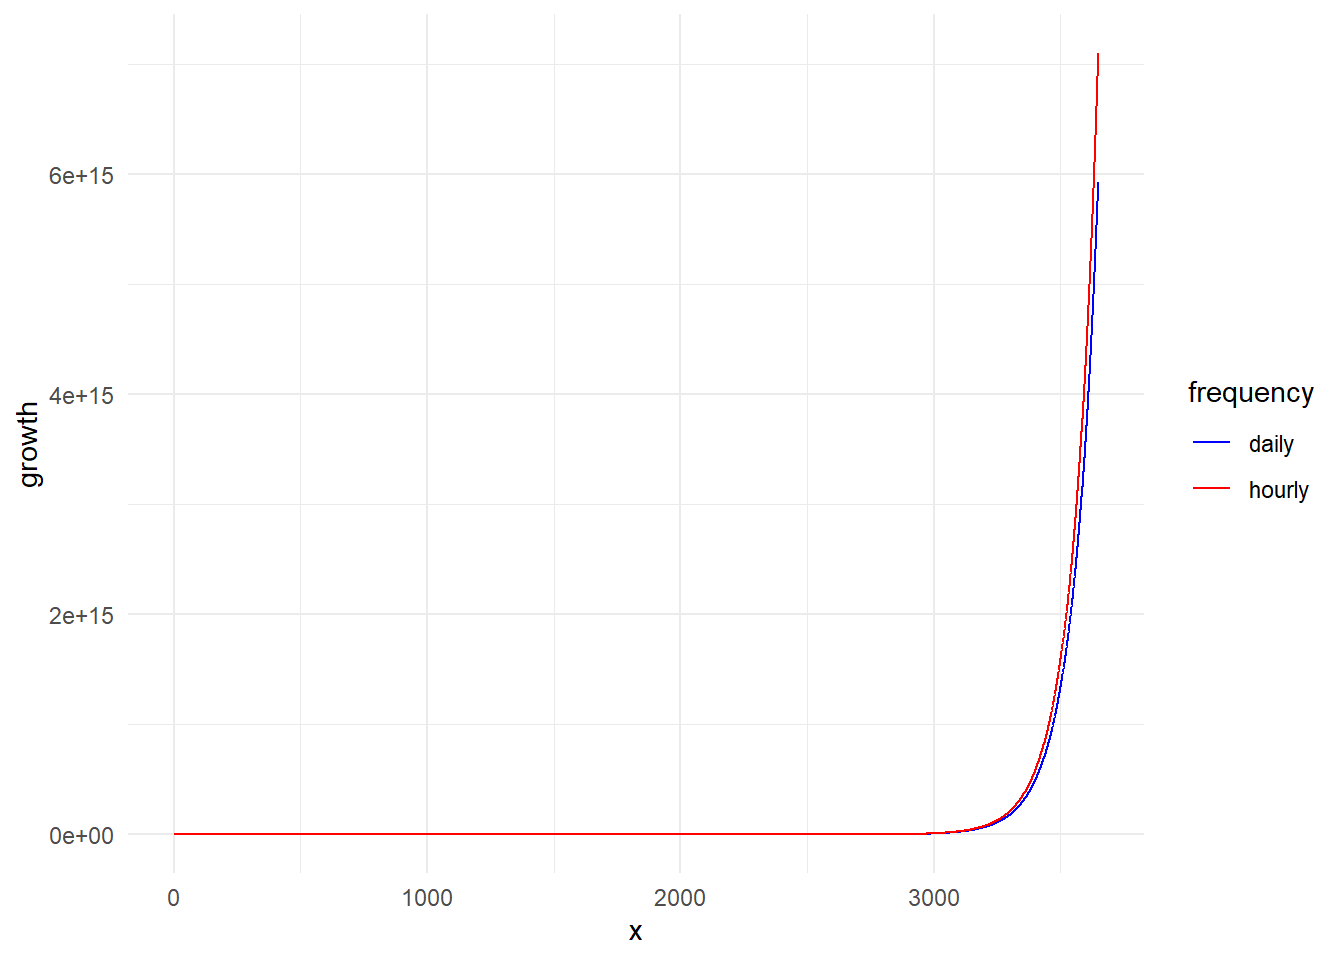
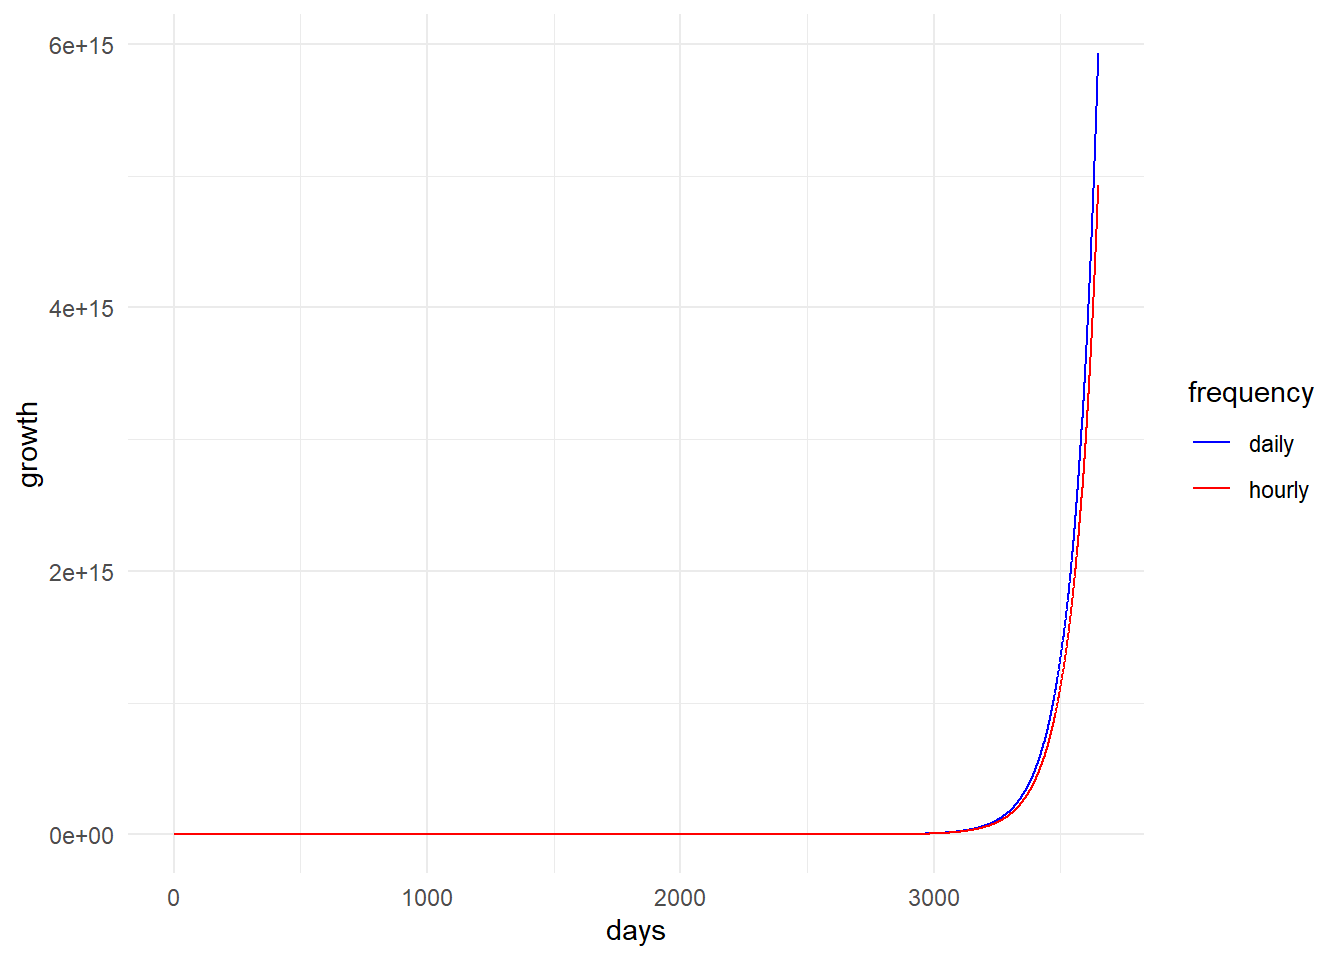
assume one grow 0.001 per hour:
- the first model assumes daily growth of 0.024 after 365 days
- the second model assumes hourly growth of 0.0099 after 365*24 hours, due to context switching of reflection
a <- tibble(x = 1:(365*10)) %>%
  mutate(daily = 1.01^x, hourly = (1+0.0099/100)^(x*100)) %>%
  pivot_longer(cols = c(daily, hourly), names_to = "frequency", values_to = "growth")

ggplot(a) +
  aes(y = growth, x = x, colour = frequency) +
  geom_line() +
  scale_color_manual(values = c("blue", "red"))  +
  xlab("days")